ZHCSIJ8A July 2018 – October 2021 TPS3431-Q1
PRODUCTION DATA
- 1 特性
- 2 應用
- 3 說明
- 4 Revision History
- 5 Pin Configuration and Functions
- 6 Specifications
- 7 Detailed Description
- 8 Application and Implementation
- 9 Power Supply Recommendations
- 10Layout
- 11Device and Documentation Support
- 12Mechanical, Packaging, and Orderable Information
封裝選項
機械數(shù)據(jù) (封裝 | 引腳)
- DRB|8
散熱焊盤機械數(shù)據(jù) (封裝 | 引腳)
- DRB|8
訂購信息
6.8 Typical Characteristics
all typical characteristics curves are taken at 25°C with 1.8 V ≤ VDD ≤ 6.5 V (unless other wise noted)
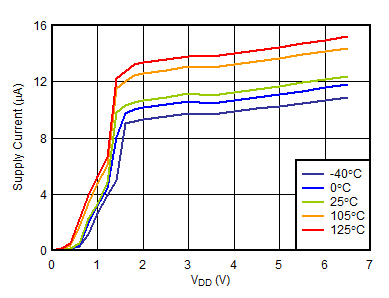 Figure 6-3 Supply Current vs VDD
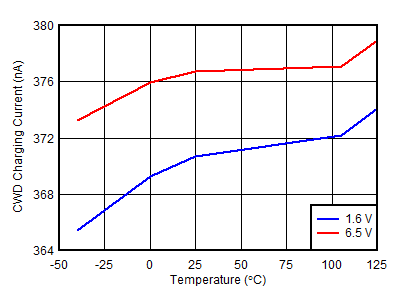 Figure 6-5 CWD Charging Current vs Temperature
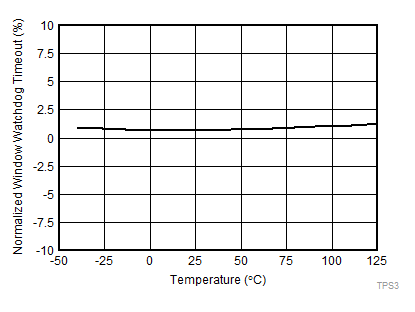 Figure 6-7 Normalized Watchdog Timeout (tWD) Accuracy (SET1 = 1, CWD = 10kΩ)
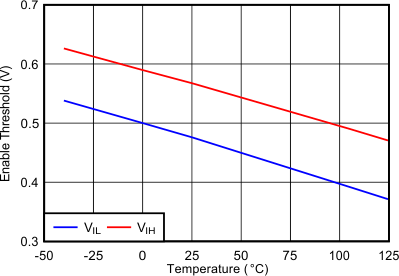
| VDD = 1.8 V |
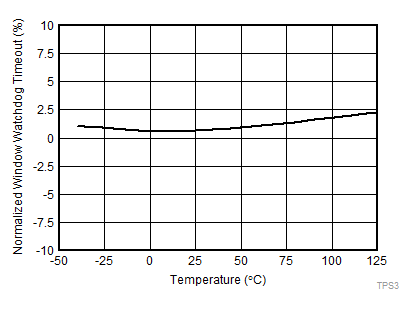 Figure 6-6 Normalized Watchdog Timeout (tWD) Accuracy (SET1 = 1, CWD = NC)