ZHCSAO1D January 2013 – August 2016 CSD97374Q4M
- 1 特性
- 2 應(yīng)用
- 3 說明
- 4 修訂歷史記錄
- 5 Pin Configuration and Functions
- 6 Specifications
- 7 Detailed Description
- 8 Application and Implementation
- 9 Layout
- 10器件和文檔支持
- 11機(jī)械封裝和可訂購信息
封裝選項(xiàng)
機(jī)械數(shù)據(jù) (封裝 | 引腳)
- DPC|8
散熱焊盤機(jī)械數(shù)據(jù) (封裝 | 引腳)
訂購信息
8.5.3 Calculating SOA Adjustments
- SOA adjustment for switching frequency ≈ 0.3°C (Figure 5)
- SOA adjustment for input voltage ≈ 1.2°C (Figure 6)
- SOA adjustment for output voltage ≈ –1.1°C (Figure 7)
- SOA adjustment for output inductor ≈ 1.4°C (Figure 8)
- Final calculated SOA adjustment = 0.3 + 1.2 + (–1.1) + 1.4 ≈ 1.8°C
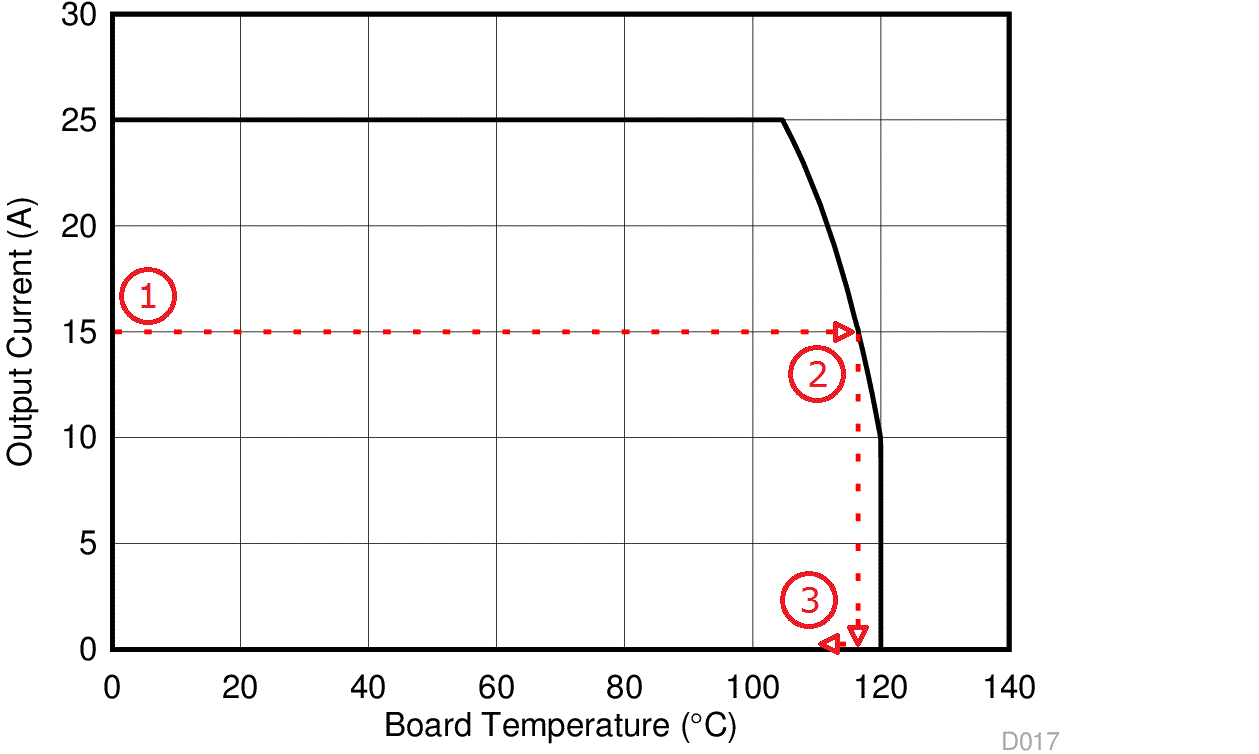
 Figure 15. Power Stage CSD97374Q4M SOA
In the design example above, the estimated power loss of the CSD97374Q4M would increase to 3.1 W. In addition, the maximum allowable board and/or ambient temperature would have to decrease by 1.8°C. Figure 15 graphically shows how the SOA curve would be adjusted accordingly.
- Start by drawing a horizontal line from the application current to the SOA curve.
- Draw a vertical line from the SOA curve intercept down to the board/ambient temperature.
- Adjust the SOA board/ambient temperature by subtracting the temperature adjustment value.
In the design example, the SOA temperature adjustment yields a reduction in allowable board/ambient temperature of 1.8°C. In the event the adjustment value is a negative number, subtracting the negative number would yield an increase in allowable board/ambient temperature.