SLYA036B July 2018 – November 2021 DRV5053 , DRV5053-Q1 , DRV5055 , DRV5055-Q1 , DRV5056 , DRV5056-Q1 , DRV5057 , DRV5057-Q1
- Trademarks
- 1Introduction
- 2Overview
- 3Device Descriptions
-
4Methods
- 4.1 Uncalibrated Implementations
- 4.2 Peak Calibrated Implementations
- 4.3 Lookup Table Calibration Implementations
- 4.4 Peak Calibrated Plus Lookup Table Hybrid
- 5References
- 6Revision History
4.3.2.3 Accuracy
With just one sensor, only the linear region of the curve in Figure 4-10 is usable. This span is ≈140°; therefore, the magnet must be roughly positioned so that the desired measurement range falls within the 140° linear region. The accuracy for this method largely depends on the spacing between the calibration points, and is estimated using Equation 5.
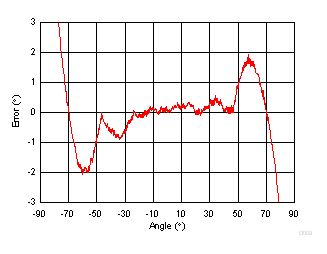
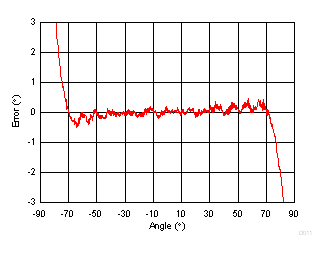
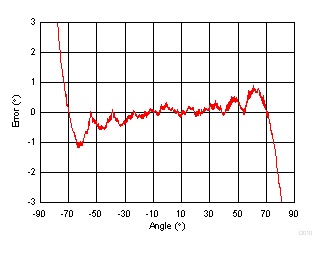
Figure 4-14, Figure 4-15, and Figure 4-16 each show an example of a possible error curve for this setup with a different number of calibration points, calibrated between ±70°.
 Figure 4-14 One Sensor Lookup Table Calibrated Error, 7 Cal Points, ≈ 4° Peak-to-Peak Error
 Figure 4-16 One Sensor Lookup Table Calibrated Error, 16 Cal Points, ≈ 1° Peak-to-Peak Error
 Figure 4-15 One Sensor Lookup Table Calibrated Error, 10 Cal Points, ≈ 2° Peak-to-Peak Error